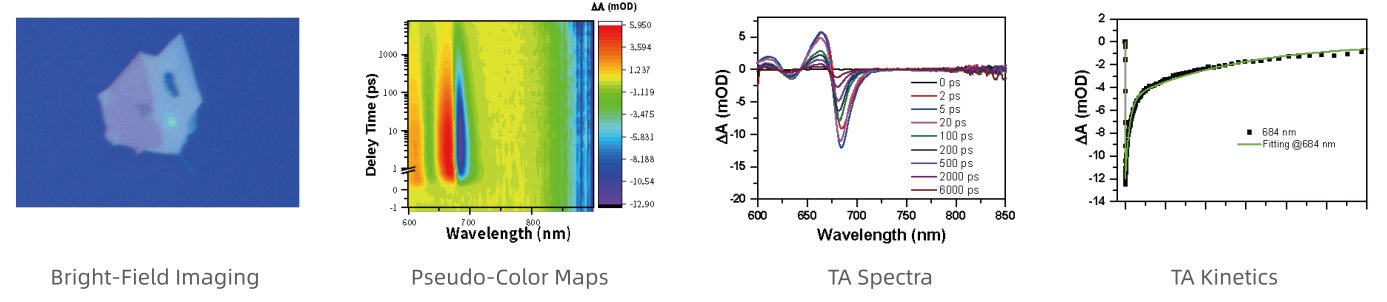


The TA-AUTO and TA-MINI are transient absorption spectrometers designed to probe photo-induced electronic transitions and excited-state dynamics in various materials.
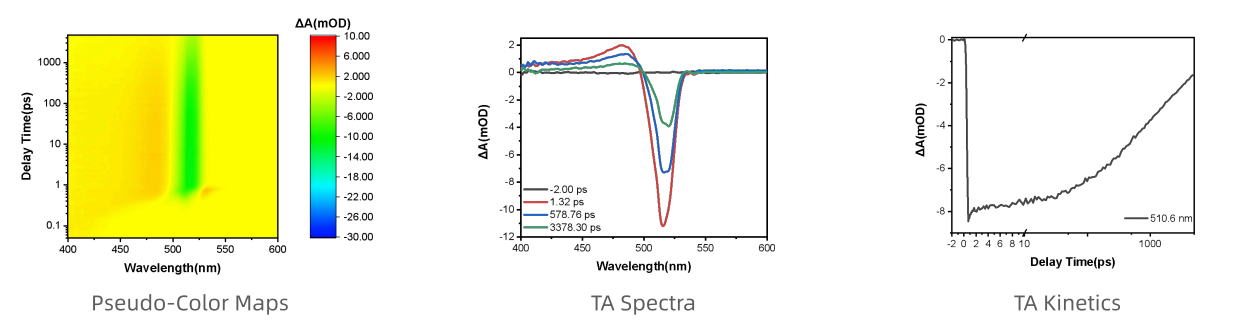
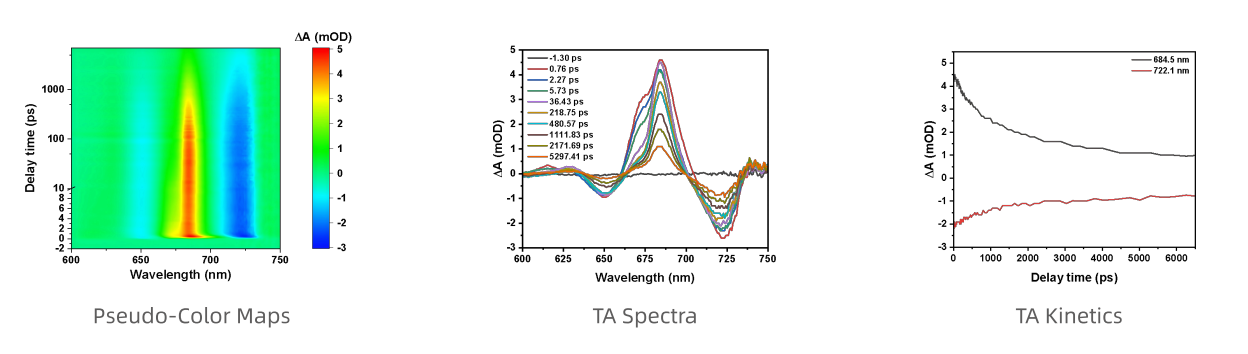
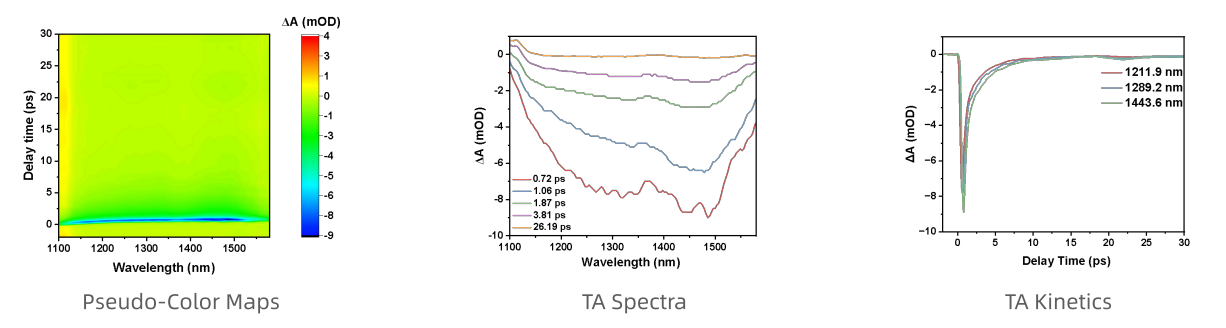
TA-AUTO: Covers a broad spectral range from ultraviolet (UV) through visible and near-infrared (NIR) to mid-infrared (MIR).
TA-MINI: Covers a broad spectral range from ultraviolet (UV) through visible.
TA-AUTO: Covers a broad spectral range from ultraviolet (UV) through visible and near-infrared (NIR) to mid-infrared (MIR).
TA-MINI: Covers a broad spectral range from ultraviolet (UV) through visible.
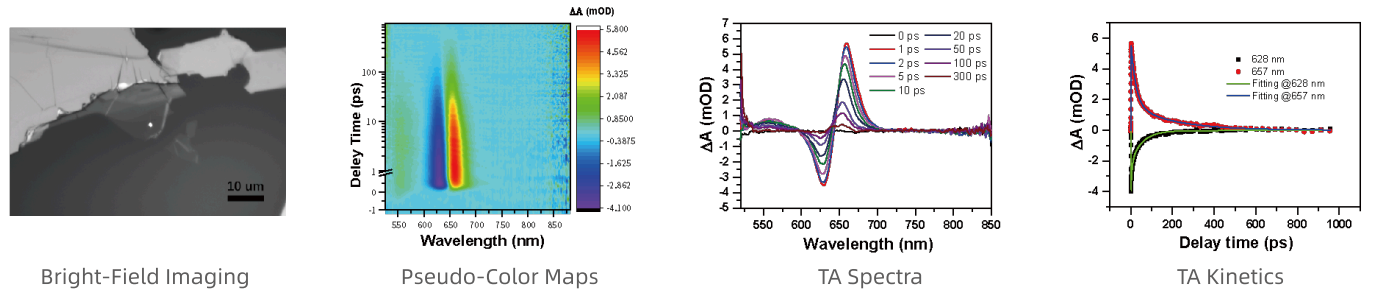
Supports time resolutions ranging from femtoseconds to microseconds. These systems can be integrated with a microscopy module to achieve
high-spatial-resolution transient absorption spectroscopy.
high-spatial-resolution transient absorption spectroscopy.
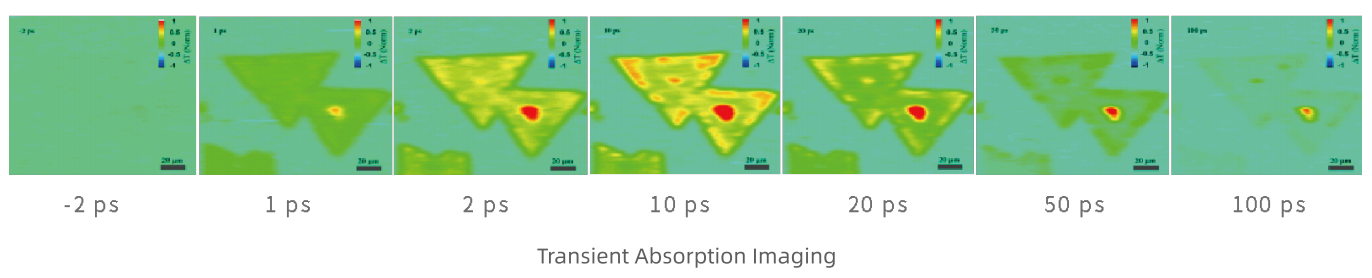
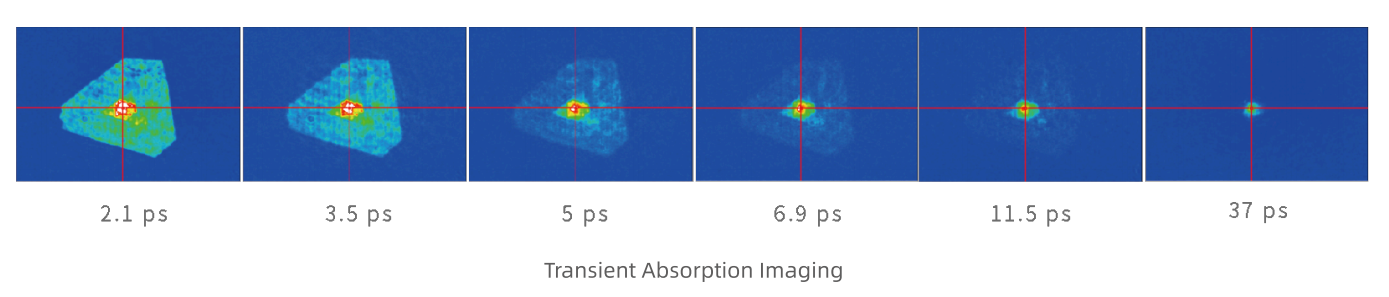
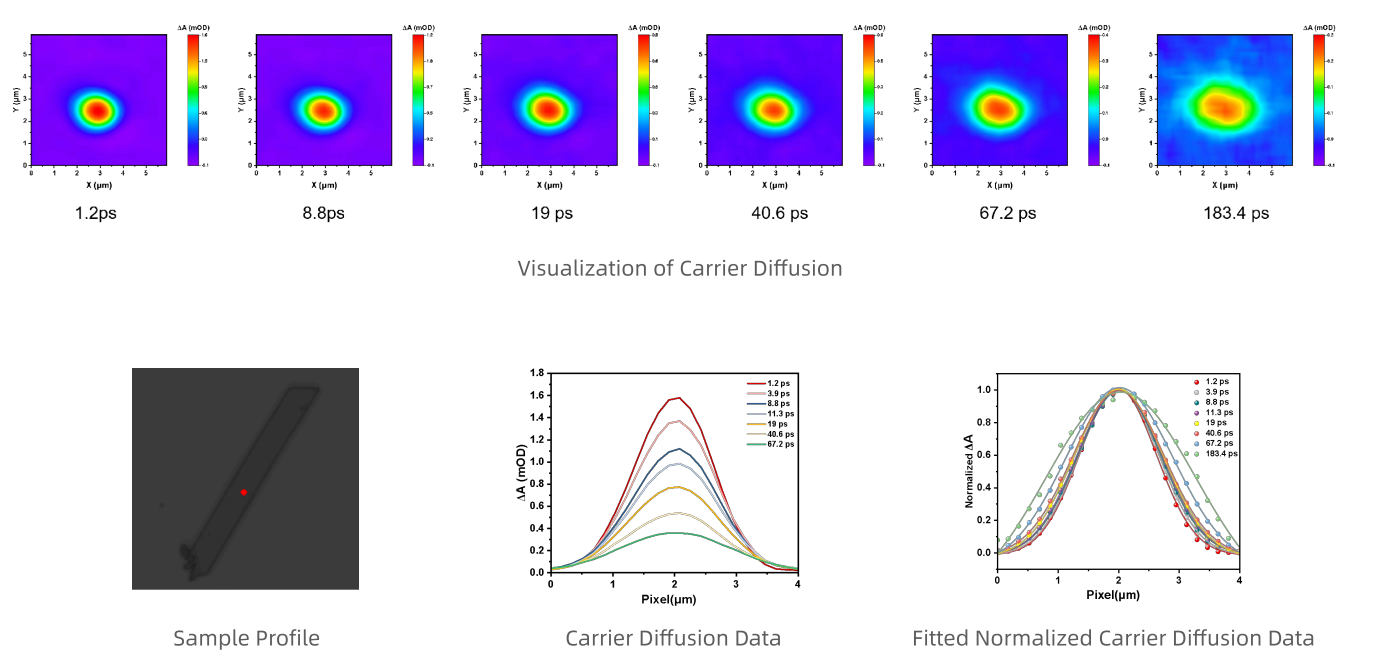
Additionally, these systems can incorporate a high-speed CMOS area camera to enable spatial defect mapping and the
characterization of carrier diffusion and mobility. For high-repetition-rate laser sources, they can be further expanded with high-speed detectors to enhance detection sensitivity, achieving a detection limit as low as ≤10 -5 OD.
characterization of carrier diffusion and mobility. For high-repetition-rate laser sources, they can be further expanded with high-speed detectors to enhance detection sensitivity, achieving a detection limit as low as ≤10 -5 OD.
Inquire